Contaminant Mapping
INSIGHT INTO CONTAMINANT MAPPING

Step 1 – Initial Mapping Activity (Noise)
It is ideal to further process the results of the initial survey into a contour map. These maps are easy to communicate to employees and upper management, and are ideal for posting within the workplace. They can identify sources of a contaminant, and in the case of dust and carbon monoxide, even determine air patterns and system balance.

Step 2 – Contour Mapping of Measured Noise Levels
Once sources have been identified, potential engineering controls can be deployed. In this fictional example, enclosures were placed around the highest identified noise sources (the motors). A follow-up map showed the effect of the engineering change, as half of the workplace that had earlier exceeded 80 dBA was now below that threshold, and the noise exceeding 85 dBA was mitigated from floor employees. The end result was that the majority of employees that exceeded 85 dBA over a full-shift was greatly reduced. Employees can now communicate more easily, the need for annual audiometric tests is reduced, and with further modifications (targeting the remaining contour in Production/Packaging), it may be possible to further reduce the noise levels within the facilities.

Step 4 – Follow-up Noise Map (After Step 3 – Engineering Controls)
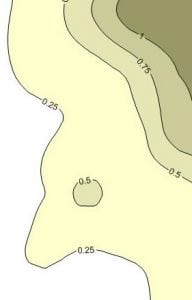
Respirable Dust Contour
- Respirable Dust (Crystalline Silica, Manganese, etc.)
- Gases (Carbon Monoxide, Nitrogen Dioxide, Carbon Dioxide)
- Solvents (Benzene, Toluene, Xylenes, etc.)
- Temperature
An example contour for respirable dust (targeting respirable crystalline silica) is shown to the right. This contour would be placed onto a transparent layer and overlaid onto a facility layout map. This greatly aids in determining sources and establishing a control program.
Recent Posts
 The Science of Taste: Industrial Hygiene and Food FlavoringsFebruary 20, 2019
 Industrial Hygiene Misconceptions #4 – Are You Sure Your Real-time Respirable Silica Correction Factor is Correct?September 11, 2018
- Industrial Hygiene Misconceptions #3 – PIDs: Lamps and Response and Electron Volts…Oh My!June 15, 2018
 Beyond Sand and Stone – 10 Surprising Sources of Potential Respirable Crystalline Silica ExposureJune 6, 2018
 Industrial Hygiene Misconceptions #2 – Carbon Monoxide in All the Wrong PlacesMay 31, 2018
 Industrial Hygiene Misconceptions #1 – The Misnomer of “Total Dust”May 24, 2018