Foreword
This is the third part of a series I hope to continue that deals with some interesting experiences I’ve had in my industrial hygiene journey. The first article covered the “Misnomer of Total Dust”. The second article dealt with “Carbon Monoxide in All the Wrong Places”. As with the previous posts, I’d like to speak about a topic that both surprised and confounded my early career as an industrial hygiene professional. After all “having experience means you have made all the mistakes”. I hope that this article will save another hygienist a headache or two when it comes to the use of photoionization detectors (PIDs).
One of the primary tools often utilized by industrial hygienists are screening instruments. Draeger tubes, aerosol monitors, flame-ionization detectors, and others can all be effective at quickly and cost-effectively determining areas best suited for later exposure sampling. After all, these instruments provide instant feedback. Contrast that to traditional industrial hygiene sampling, where media is placed onto employees for long time periods (typically 8 hours), sent to a laboratory, analyzed, then reported. The former can provide information in seconds, the latter takes weeks. Also, the analysis of single cassette/badge/tube can cost up to several hundred dollars for a single data point. A real-time instrument can produce thousands of results at minimal cost (really just the rental price or cost of the instrument itself).
However, these instruments can produce data that is often unexpected. In my career, I particularly remember using a PID to evaluate some obviously impacted soils during the construction of the Marquette Interchange. My instrument continued to show zeroes, despite some strong solvent-like odors. The odors I detected were likely chlorinated solvents, which my PID was not effective at quantifying. Subsequent project work continued to reiterate to me the care that is needed when using these very useful (and fraught with potential error) real-time instruments.
The PID: A Powerful Tool
PIDs can be utilized to detect a wide variety of volatile organic compounds and other gases. There are a number of commercially available options of meters. Several of these are shown below:
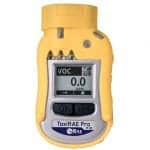
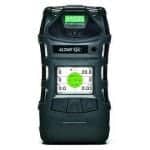
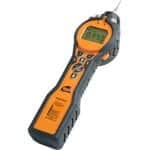
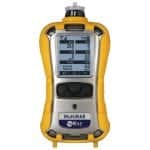
These instruments are all very effective at evaluating concentrations of select gases within an environment. As can be seen from the photos, there is significant variety. Some of the instruments are intended to be worn by the employees, while others are handheld. Several models have the capability to house multiple sensors to detect a variety of constituents simultaneously, while others are single gas meters. Each instrument functions in a similar way though, through the use of a lamp.
A Brief Discussion on Lamps
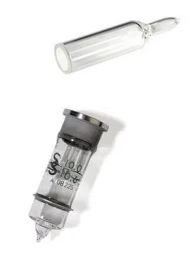
The ultraviolet (UV) lamp within a PID (an example is shown to the right) has a specific ionization energy (or ionization potential). The most common lamp type is 10.6 electron volts (eV), though there are a number of commonly available lamps including those with both lower energies (i.e. 9.8 eV) and higher energies (i.e. 11.7 eV). This lamp selection is a critical step that is often not considered. Using an instrument with a lamp that isn’t suitable for the expected gases will yield results that don’t reflect the environment. Simply put, these lamps function by photoionizing molecules that enter the chamber resulting in the ejection positively charged ions. The ions produce an electric current, which is then outputted by the detector, giving a reading. In order to produce the ions (and create a reading), your lamp needs to meet or exceed the applicable chemical’s ionization energy.
But is the Instrument in Capable Hands?
Here is a hypothetical example showing the complications that can arise when not putting the proper thought into planning screening measurements using a PID.
You are an industrial hygienist working at the BAMM Corporation, a facility that manufactures benzene, ammonia, methylene chloride, and methane. Each of your manufacturing areas is well controlled (rightfully so, as these chemicals each pose significant hazards), but you have recently begun to hear of odor complaints, with several workers also complaining of headaches. Rather than jump right into the collection of full-shift samples, you decide first to grab a multi-function meter that includes a PID sensor. You smartly calibrate the instrument in its dock with isobutylene before use (everything checks out great) and off you go.
You perform a number of measurements in each manufacturing area, and record the following results (published odor thresholds are also shown for comparison):
PID Results – Instrument #1 (Morning)
Benzene Room – 0.1 ppm – 0.5 ppm (Odor Threshold – 8.7 ppm)
Ammonia Room – 0.0 ppm – 0.0 ppm (Odor Threshold – 5.8 ppm)
Methylene Chloride Room – 0.0 ppm – 0.0 ppm (Odor Threshold – 0.9 ppm)
Methane Room – 0.0 ppm – 0.0 ppm (Odor Threshold [mercaptans] – 0.001 ppm)
You find the results to be somewhat surprising, especially since you did notice a slight odor in several of the rooms, particularly the ammonia and methylene chloride areas. You decide to keep an eye on these areas, and measure again in the afternoon. But on your way back to the office, you drop your instrument on the ground, cracking the case and putting it out of commission. You quickly send it off for repair, and ask a friend in a nearby facility if you could borrow their PID for the later measurements. Amazingly, they even have the same model instrument as you, so you can jump right into the measurements.
You calibrate your borrowed PID, and thankfully it spans perfectly with your isobutylene gas. You again travel out to the floor, but are shocked to note significantly different results.
PID Results – Instrument #2 (Afternoon)
Benzene Room – 0.1 ppm – 0.4 ppm (Odor Threshold – 8.7 ppm)
Ammonia Room – 2.0 ppm – 2.5 ppm (Odor Threshold – 5.8 ppm)
Methylene Chloride Room – 0.9 ppm – 1.2 ppm (Odor Threshold – 0.9 ppm)
Methane Room – 0.0 ppm – 0.0 ppm (Odor Threshold [mercaptans] – 0.001 ppm)
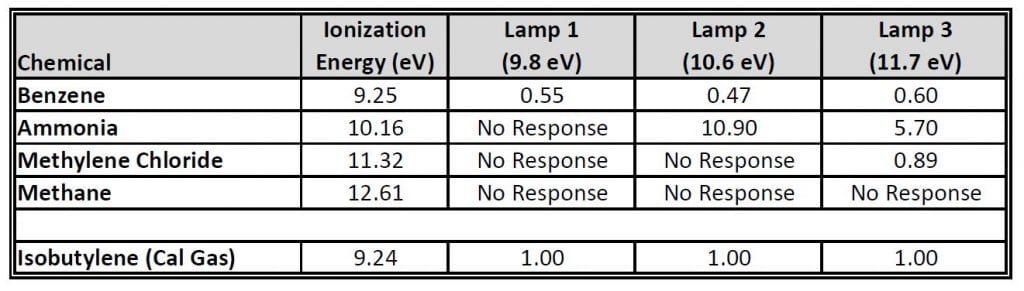
Now instead of zeros, you are reading concentrations throughout in both the Ammonia and Methylene Chloride areas. How can this be? Conditions are the same, and the measurements were only separated by a couple hours. You look into the manuals for each of the instruments, and review your downloaded data. And that is when you see the answer. The lamps in each meter were different. Your meter has a 9.8 eV lamp, while your friend’s has an 11.7 eV lamp. When looking in the manual, you also see a table of responses that includes the chemicals you were measuring.
Lessons Learned and Knowledge Gained
After reviewing the above table, you are slightly embarrassed to find that you used the improper instrument in your initial survey. Surprisingly, two PIDs that look identical from the outside can produce significantly different results. While your calibration gas calibrated each instrument perfectly (which it should, as the response is shown as 1.0 for each meter), the expected results for each of the four target gases varies significantly. In fact, based upon the table, your 9.8 eV lamp would not detect any concentration of ammonia or methylene chloride. Also, your measurements within the methane area look to have been a waste of time, as neither instrument could detect that gas.
Further, you see that the responses for each chemical differs between lamps (ammonia’s response varies from “no response” to 10.9 to 5.7 for the three listed options). In order to correct your measurements, you need to multiply your numbers by the listed correction factor. This is necessary because your instrument was calibrated to isobutylene, not the specific chemicals you were looking for.
Using the table, you correct your measurements from the afternoon, and find the estimated concentrations to be:
Corrected Results (Afternoon)
Benzene Room – 0.1 ppm – 0.2 ppm (Odor Threshold – 8.7 ppm)
Ammonia Room – 11.4 ppm – 14.3 ppm (Odor Threshold – 5.8 ppm)
Methylene Chloride Room – 0.8 ppm – 1.1 ppm (Odor Threshold – 0.9 ppm)
Methane Room – 0.0 ppm – 0.0 ppm (Odor Threshold [mercaptans] – 0.001 ppm)
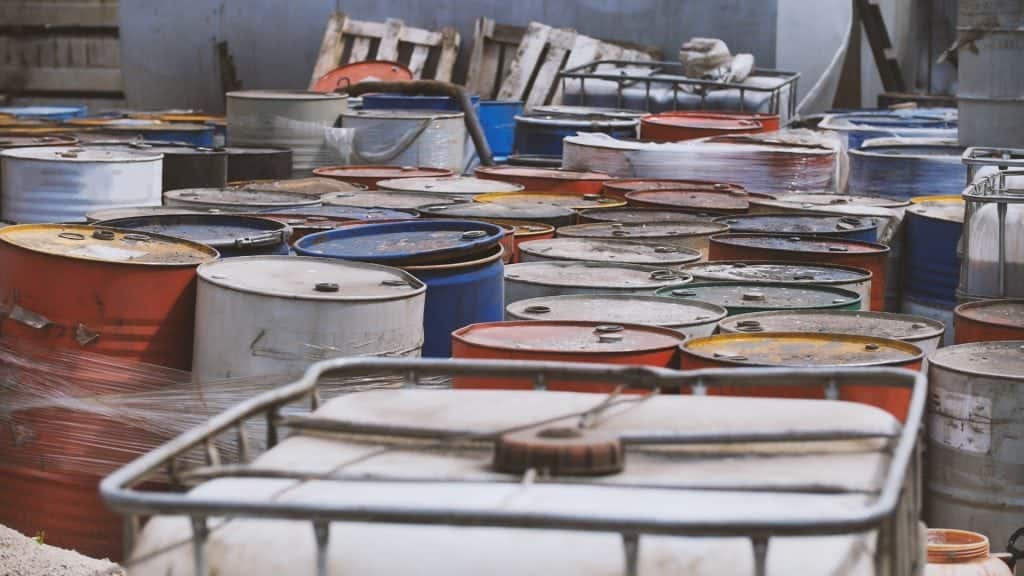
Now your measurements agree with your observations! As with many real-time devices, it is easy to collect erroneous data even with the best of intentions. The hygienist in this example was careful in calibrating the instrument before use, and collected detailed measurements in each of the areas. Their senses suggested there were concentrations present (noticeable odor), and some surprising data led to additional investigation and the discovery of the differing lamps and response factors. You don’t always have the benefit of your senses (many chemicals have odor thresholds above concentrations that would be of concern) and most times you will not have the benefit of multiple instruments when evaluating an area. Additionally, these challenges were encountered in locations where pure forms of the target chemicals were present. Imagine the complexity of an environment with dozens of unknown substances (like the drum storage in the header picture)!
Conclusion
The takeaways from this text should be to:
- Select the proper lamp for the chemical(s) you are measuring.
- Be sure to utilize the published response factors for your instrument. The concentration readout on the screen of your detector often is not accurate to the chemical.
- Remember to read the manual. PIDs, like many instruments, have many sources of error. In addition to the response factors/lamp selection, these instruments can also be sensitive to moisture, temperature, pressures, interfering chemicals, and concentration range errors.
- As always, calibrate your instruments! Utilizing recently spanned/zeroed instruments (or better yet, having a canister of gas handy), can provide confidence that the meter is functioning properly.
As with many instruments, it is easily possible to collect inaccurate data even after proper zeroing and span calibration of a PID. Avoid embarrassing mistakes by reviewing instrument operation before you rush out and collect measurements that don’t represent the actual environment!